Image Details
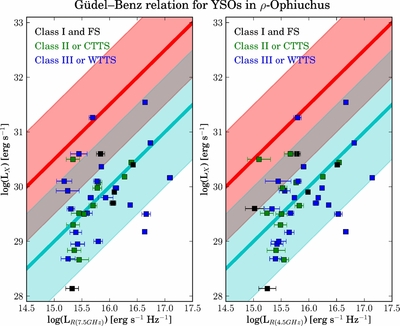
Caption: Figure 7.
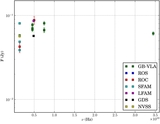
X-ray luminosity as a function of radio luminosity. The red line corresponds to the Güdel–Benz relation with κ = 1 while the red strip centered on it represents a one order of magnitude dispersion around that relation. The blue line and strip correspond to the Güdel–Benz relation but with κ = 0.03. Colors indicate the evolutionary status of the object as explained at the top left of the diagram.
Other Images in This Article


Copyright and Terms & Conditions
© 2013. The American Astronomical Society. All rights reserved.
Copyright ©
2026 Astronomy Image Explorer. All Rights Reserved.