Image Details

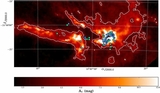
Caption: Figure 1.
Extinction map of the Ophiuchus complex obtained as part of the COMPLETE project (Ridge et al. 2006) based on the 2MASS data (Skrutskie et al. 2006). The Lynds dark clouds in the regions are indicated, and a linear distance is provided (assuming a distance of 120 pc to the entire region—Loinard et al. 2008). The turquoise circles indicate the areas mapped with the VLA for the survey presented here. The diameter of each circle is 6′ and corresponds to the primary beam of the VLA at 7.5 GHz. Note that the field of view, and therefore also the total mapped area, at 4.5 GHz, is significantly larger.
Other Images in This Article
Copyright and Terms & Conditions
© 2013. The American Astronomical Society. All rights reserved.