Image Details
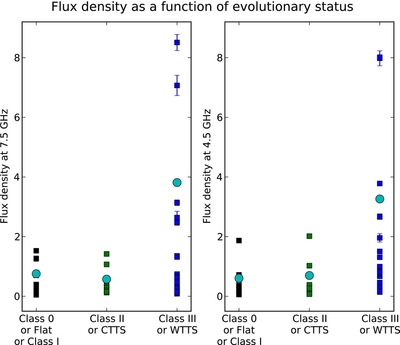
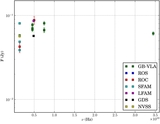
Caption: Figure 5.
Radio flux at 7.5 GHz (left) and 4.5 GHz (right) as a function of YSO evolutionary status. As in the previous figures, the individual sources are shown with their error bars, and the black circles indicate the mean flux for each category.
Other Images in This Article

Copyright and Terms & Conditions
© 2013. The American Astronomical Society. All rights reserved.
Copyright ©
2026 Astronomy Image Explorer. All Rights Reserved.