Image Details
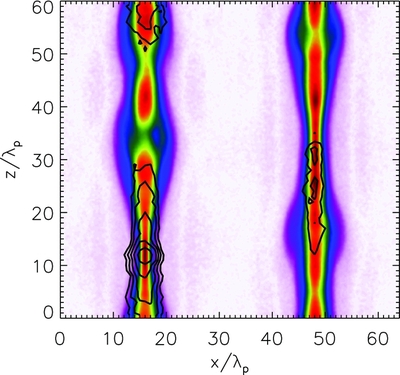
Caption: Figure 8.
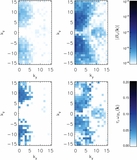
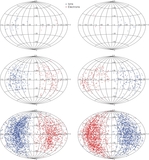
The locus of particle acceleration in simulation
S2K025 in the interval 47 τ
c
⩽
t ⩽ 70 τ
c
corresponding to the primary particle energization phase. The contours show the logarithm of the
y-averaged energy gain per particle per unit volume
![]() (
x,
z) for the ≈2000 highest-energy particles in the simulation in this interval (see text); the lowest contour corresponds to
0.04 times the peak value of
(
x,
z) for the ≈2000 highest-energy particles in the simulation in this interval (see text); the lowest contour corresponds to
0.04 times the peak value of
![]() . The underlying color image shows the projection in the
xz plane of the current density
J
y
averaged over the interval; the current density is scaled linearly from light purple to dark red.
. The underlying color image shows the projection in the
xz plane of the current density
J
y
averaged over the interval; the current density is scaled linearly from light purple to dark red.
Other Images in This Article

Copyright and Terms & Conditions
© 2013. The American Astronomical Society. All rights reserved.