Image Details
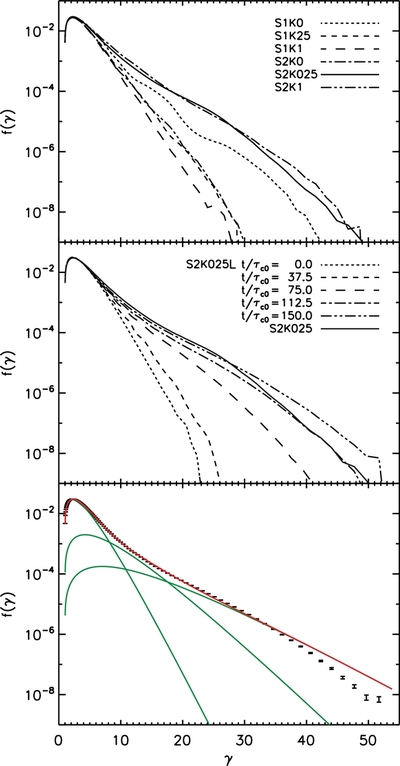
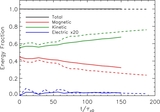
Caption: Figure 7.
Particle energy spectra in the six smaller size simulations at time t = 150 τ c0 (top panel; see legend) and in the large size simulation S2K025L at five different times (middle panel; see legend) where for reference we include the t = 150 τ c0 spectrum from the corresponding smaller size simulation S2K025 (solid line). The bottom panel compares the final spectrum to a model containing three thermal populations at different temperatures (red line; see text), including the spectra of the three individual thermal components (green lines). The spectra and uncertainties are calculated from a random sample containing 5% of the particles in the simulation.
Other Images in This Article
Copyright and Terms & Conditions
© 2013. The American Astronomical Society. All rights reserved.