Image Details
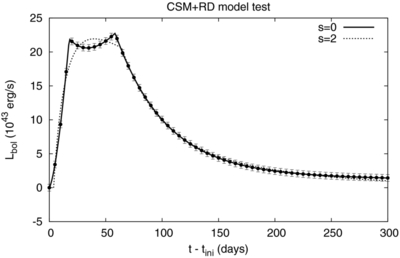
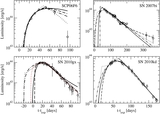
Caption: Figure 8.
Comparison of CSM+RD models having different density exponents s = 0 (constant density CSM) and s = 2 (wind-like CSM). The dotted curve represents the initial synthetic model computed assuming s = 0 (see Table 12). The solid curve shows the best-fit s = 0 model found by MINIM. As seen in Table 12, the parameters of the initial model are recovered very well. Dotted curve shows the best-fit s = 2 model. Although the shapes of the LCs are similar, the parameters are quite different in the latter case (Table 12).
Other Images in This Article
Copyright and Terms & Conditions
© 2013. The American Astronomical Society. All rights reserved.
Copyright ©
2026 Astronomy Image Explorer. All Rights Reserved.