Image Details
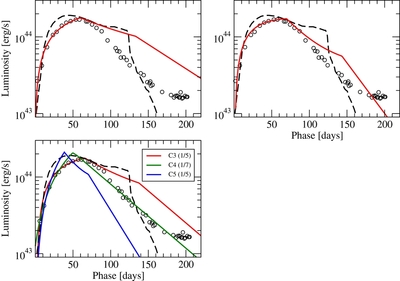
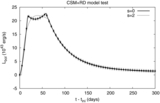
Caption: Figure 1.
Comparison of the LCs from the hybrid CSM+RD model with the observed KAIT photometry of SN 2006gy. The model parameters are listed in Table 1. The dashed curve shows the model LC computed with the same parameters as model F1 of Moriya et al. (2013) scaled to fit the observed maximum luminosity. Our additional models are plotted as colored continuous curves: model C1 (upper left panel), model C2 (upper right panel), and models C3, C4, and C5 (lower left panel; the models are scaled to the observations with a factor indicated in the legends). Model C4 provides a reasonable fit to the observations.
Other Images in This Article
Copyright and Terms & Conditions
© 2013. The American Astronomical Society. All rights reserved.