Image Details
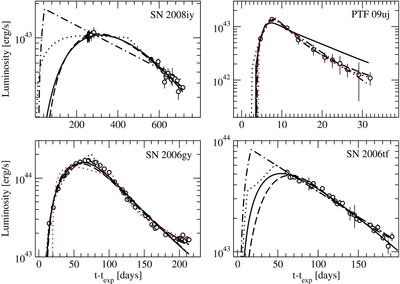
Caption: Figure 2.
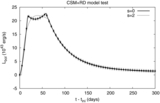
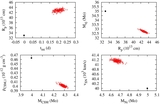
Lowest χ 2 model fits to the observed LCs of SN 2008iy (upper left panel), PTF 09uj (upper right panel), SN 2006gy (lower left panel), and SN 2006tf (lower right panel). Solid curves correspond to the RD model, dashed curves to the MAG model, dashed-dotted curves to the TH model, and dotted curves to the hybrid CSM+RD model in the case of constant density CSM shell ( s = 0). The red dotted curves show the best-fit CSM+RD model for the choice s = 2 (steady-state wind CSM); this model is inferior to all the others for SN 2006gy. Parameters of the best-fit models are given in Tables 3–7.
Other Images in This Article
Copyright and Terms & Conditions
© 2013. The American Astronomical Society. All rights reserved.
Copyright ©
2026 Astronomy Image Explorer. All Rights Reserved.