Image Details
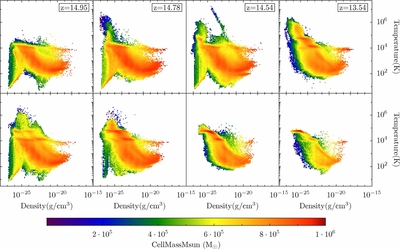
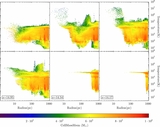
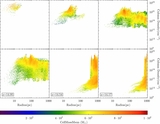
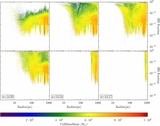
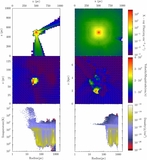
Caption: Figure 9.
Density–temperature phase diagram within a sphere of 1 kpc diameter for the XDR S (top) and XDR Z (bottom) cases at z = 14.95, 14.78, 14.54, and 13.54, from left to right.
Other Images in This Article
Show More
Copyright and Terms & Conditions
© 2013. The American Astronomical Society. All rights reserved.
Copyright ©
2025 Astronomy Image Explorer. All Rights Reserved.