Image Details
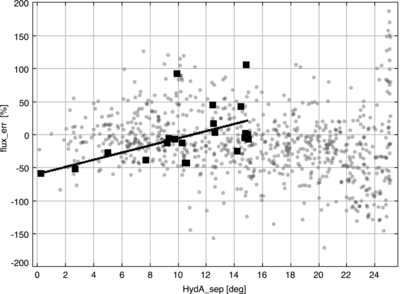
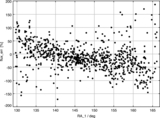
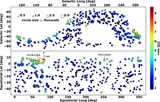
Caption: Figure 9.
Fractional difference between peak fluxes in two overlapping MWA32 facets vs. distance from Hydra A, which is seven times brighter than the next brightest source in either image. The error in bright sources (>1 Jy, black squares) generally tracks that of the full set of sources (gray dots), but the bright sources nearest Hydra A show a depression of their flux consistent with sitting in a negative sidelobe of Hydra A. The black line is not a formal fit but shows the systematic suppression of bright sources <8°from Hydra A.
Other Images in This Article

Copyright and Terms & Conditions
© 2013. The American Astronomical Society. All rights reserved.
Copyright ©
2025 Astronomy Image Explorer. All Rights Reserved.