Image Details
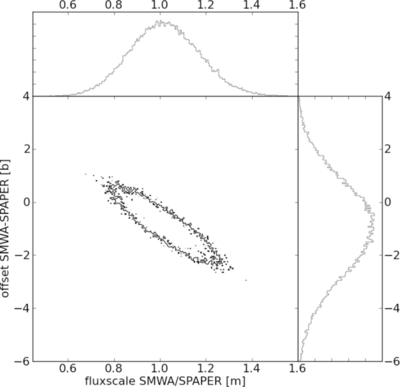
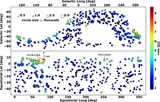
Caption: Figure 5.
Posterior probability distribution of the PAPER/MWA flux calibration. The output of the flux relationship fit is a series of samples of the model parameters, slope ( m), and intercept ( b). The occupation number of each m, b value is a sample of the posterior probability and the projection down to either variable gives the marginalized distribution. The histograms on the sides give the marginalized likelihood. The marginalized flux scale or slope is analogous to the distribution of flux scales used in Jacobs et al. (2011). The peak probability occurs at a flux scale of unity and intercept of −0.5; the contour shown encloses the solutions having 76% probability. The slope of the probability distribution is steep; 95% probability density contours were not significantly different enough to be overplotted. The marginalized slope posterior, labeled as "flux scale" to which it is roughly analogous, reaches the 76% level at 0.8 and 1.2 indicating that the flux scale is correct to within 20%.
Other Images in This Article

Copyright and Terms & Conditions
© 2013. The American Astronomical Society. All rights reserved.