Image Details
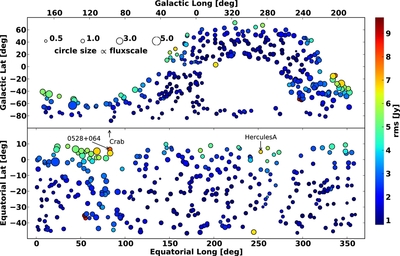
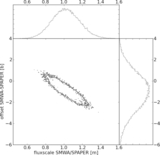
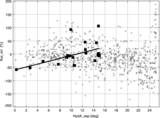
Caption: Figure 10.
Spatial distribution of the PSA32/Molonglo Reference Catalog flux ratio and local PSA32 rms in galactic (top) and equatorial (bottom) coordinates (from Jacobs 2011). Point size indicates flux scale as shown in inset key, local image rms is related by color. The area of high flux scale appears to be correlated with high rms in upper latitudes, particularly near bright sources far from pointing center. Though the error is not strictly linear with distance from the suspected source of sidelobes, inspection of the image suggests that insufficient deconvolution of Hercules A and the Crab is to blame.
Other Images in This Article

Copyright and Terms & Conditions
© 2013. The American Astronomical Society. All rights reserved.