

Image Details
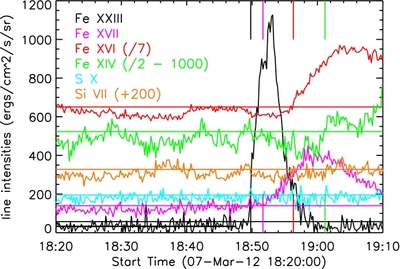
Caption: Figure 4.
Light curves derived from the EIS spectra averaged over five 1'' y-pixels along the slit around the spatial center of the flare during the run of FLAREDOP_EIS that observed the C1 flare of 2012 March 7. Color-coded horizontal lines indicate the pre-flare intensity averaged over the first 171 exposures in the sequence (indicated with the thicker, shorter black horizontal line) plus the 1σ scatter over the same exposures. The flare starts in Fe xxiii emission at 18:49:48 UT (indicated with long black vertical tick marks), as described in the text. For Fe xvii and Fe xvi, the flare starts when the line intensities continuously exceed their pre-flare averages by more than 1σ, which corresponds to 18:51:40 for Fe xvii and 18:56:19 for Fe xvi; in the case of Fe xiv, the flare starts at 19:01:09 UT, but the line intensity drops a bit below the 1σ limit during two exposures. S x and Si vii do not participate in the flare at the location of the EIS slit.
Other Images in This Article
Copyright and Terms & Conditions
© 2013. The American Astronomical Society. All rights reserved.

