

Image Details
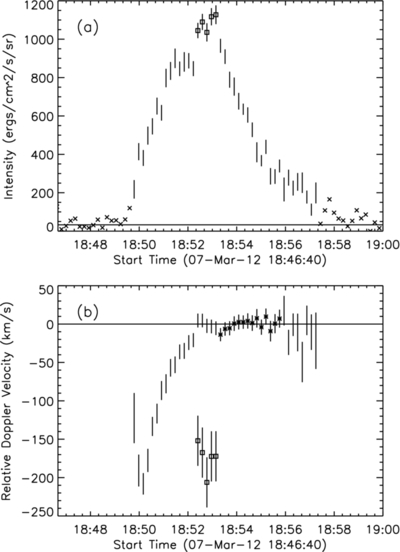
Caption: Figure 3.
(a) Light curve and (b) relative Doppler velocity plot for the Fe xxiii line at 263.8 Å observed by EIS during the C1 flare of 2012 March 7. Intensities displayed as vertical error bars only (with no symbols) are derived from exposures in which only one component to the emission line is observed; intensities displayed as boxes represent the sum of a main component (at rest) and a secondary blueshifted component; intensities displayed as Xs correspond to exposures in which no Fe xxiii emission is detected (we fit the noise; statistical uncertainties are larger than the plotted intensities). The solid horizontal line in (a) shows the pre-flare average noise. Velocities displayed as asterisks with vertical error bars correspond to exposures used to derive the reference (rest) wavelength and its 1σ scatter; velocities displayed as vertical error bars only (no symbols) are derived from exposures with significant Fe xxiii emission; those displayed as boxes correspond to the secondary, blueshifted component observed in five EIS exposures.
Other Images in This Article
Copyright and Terms & Conditions
© 2013. The American Astronomical Society. All rights reserved.

