

Image Details
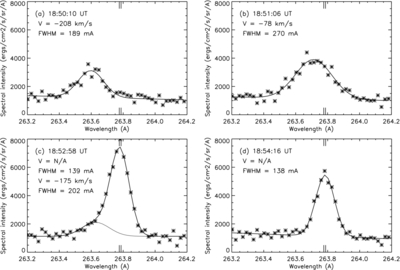
Caption: Figure 2.
Fe xxiii line profile fits at selected times (upper left of each frame) during the C1 flare of 2012 March 7. Frame (a) shows the profile with the largest upward relative Doppler velocity (upper left) during the flare's impulsive rise; this is the third EIS exposure for which significant Fe xxiii emission was observed. Frame (b) shows the profile from the eighth EIS exposure during the flare, by which time the upward velocity had decreased substantially. Note that the entire profile is blueshifted in these two frames. Frame (c) shows the profile from the fourth exposure with a significant secondary, blueshifted component; here the main component is at relative rest. Frame (d) shows a profile during the "reference" period after the flare's peak intensity; this is one of the exposures used to derive the rest wavelength and its uncertainty (1σ scatter). The extra-long vertical tick marks at the top and bottom of each frame indicate ±1σ (which corresponds to ±6.4 km s −1) about this wavelength.
Other Images in This Article
Copyright and Terms & Conditions
© 2013. The American Astronomical Society. All rights reserved.

