Image Details
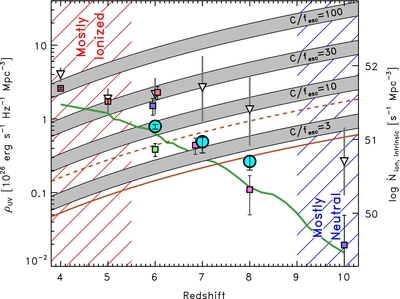
Caption: Figure 3.
Specific luminosity density (ρ UV) vs. redshift, where our observed samples, corrected for incompleteness down to M 1500 <−18, are plotted as the cyan circles. Results from the literature are shown as squares at z = 4, 5, and 6 from the GOODS fields (red; Giavalisco et al. 2004), z = 6 from the HUDF (green; Bunker et al. 2004), z = 7 and 8 from the HUDF (purple; Finkelstein et al. 2010), z = 6 from GOODS+HUDF, and z = 10 from the HUDF (blue; Bouwens et al. 2006, 2011b). All squares have been adjusted to a limiting magnitude of −18 (with the exception of the z = 7 and 8 points, which were not corrected for incompleteness). The inverted triangles denote the integrated luminosity functions down to M lim = −13 of Bouwens et al. (2007) at z = 4, 5, and 6, Bouwens et al. (2011a) at z = 7, Bradley et al. (2012) at z = 8, and Bouwens et al. (2011b) at z = 10, where the gray error bar denotes the uncertainty on these integrated values due to the uncertainty in the Schechter function parameters (particularly the faint-end slope α in the higher redshift bins). The wide gray curves denote the value of ρ UV needed to sustain a fully reionized IGM at a given redshift, for a given ratio of the clumping factor C over the escape fraction of ionizing photons f esc (Madau et al. 1999). The width of these curves represents changing stellar metallicities, from 0.02 < Z/ Z ☉ < 1.0. The orange curves show the critical value of ρ UV from the models of Shull et al. (2012), the dashed line denotes an IMF with a slope of −2.35 and an upper-mass cutoff of 200 M ☉, while the solid line denotes an IMF slope of −1.9 with an upper-mass cutoff of 100 M ☉. The right-hand vertical axis shows the corresponding intrinsic number density (i.e., prior to escape) of ionizing photons for a given specific UV luminosity density, using the median of a range of ages and metallicities, and assuming a constant star formation history. This axis can be multiplied by the reader's choice of f esc. The green curve shows the predicted luminosity density for sources brighter than M 1500 = −18 from the hydrodynamic simulations of Finlator et al. (2011).
Other Images in This Article


Copyright and Terms & Conditions
© 2012. The American Astronomical Society. All rights reserved.