Image Details
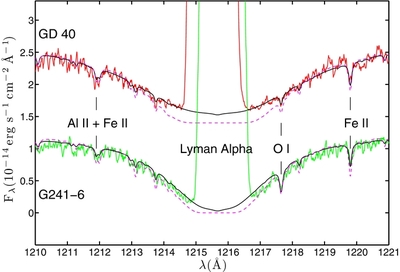
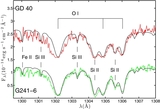
Caption: Figure 1.
Lyα absorption in GD 40 and G241-6. The black lines represent models with the "final" abundances given in Tables 3 and 4 without any interstellar contribution. The dashed pink lines represent models with [H]/[He] = −6.16 and column densities of interstellar hydrogen of 1 × 10 20 cm −2 and 3 × 10 19 cm −2 toward GD 40 and G241-6, respectively (see Section 3.2). For clarity, the spectrum for GD 40 is offset by 1.5 × 10 −14 erg s −1 cm −2 Å −1. Because the data are shifted into the star's frame of reference, the day glow emission lines for the two stars are displaced.
Other Images in This Article
Show More
Copyright and Terms & Conditions
© 2012. The American Astronomical Society. All rights reserved.
Copyright ©
2025 Astronomy Image Explorer. All Rights Reserved.