Image Details
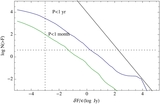
Caption: Figure 4.
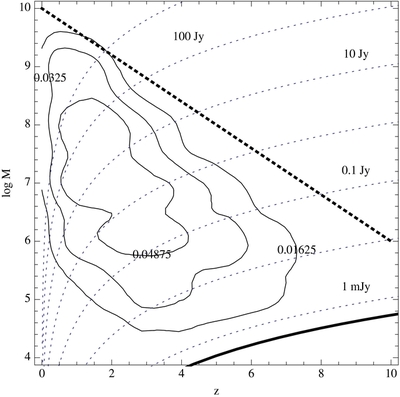
Sources with orbit period modulation Ib: mass–redshift distribution: contours of the mass–redshift distribution (solid black)
of all binary black hole outflows with
F/
![]() > =0.5 mJy (thick black curve) and observed periods
P
obs between 1 year and 1 minute. This scaled flux limit corresponds to the fiducial VAST survey sensitivity (
F = 0.5 mJy) for the most optimistic conversion of outflow to radio power (
> =0.5 mJy (thick black curve) and observed periods
P
obs between 1 year and 1 minute. This scaled flux limit corresponds to the fiducial VAST survey sensitivity (
F = 0.5 mJy) for the most optimistic conversion of outflow to radio power (
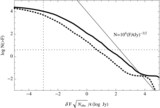
![]() = 1). Contours are shown at 1/4, 1/2, and 3/4 of the maximum value (
dN/
dlog
Mdz
= 1). Contours are shown at 1/4, 1/2, and 3/4 of the maximum value (
dN/
dlog
Mdz
![]() 0.06). The distribution shown is smoothed, built by convolving a Gaussian kernel with the underlying merger tree, with smoothing
lengths Δlog
M
0.06). The distribution shown is smoothed, built by convolving a Gaussian kernel with the underlying merger tree, with smoothing
lengths Δlog
M
![]() 0.3 in mass and (Δ
z = 0.3) in redshift. Also shown are contours of the largest possible (Eddington-limited) flux at a given redshift:
F/
0.3 in mass and (Δ
z = 0.3) in redshift. Also shown are contours of the largest possible (Eddington-limited) flux at a given redshift:
F/
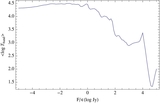
![]() =
L
edd/4π
d
2
L
ν for 10
−3, 10
−2, ..., 10
3 Jy (dotted blue, bottom to top). Finally, the thick dotted black line is an empirical relation for the maximum SMBH binary
mass vs. redshift (Equation (10)).
=
L
edd/4π
d
2
L
ν for 10
−3, 10
−2, ..., 10
3 Jy (dotted blue, bottom to top). Finally, the thick dotted black line is an empirical relation for the maximum SMBH binary
mass vs. redshift (Equation (10)).
Other Images in This Article
Copyright and Terms & Conditions
© 2011. The American Astronomical Society. All rights reserved.