Image Details
Caption: Figure 1.
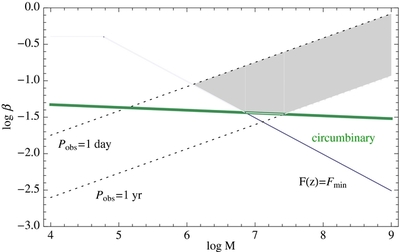
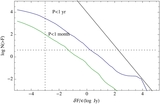
Critical orbital velocities vs. mass: for an equal-mass binary of mass
M at
z = 0.6, a plot of orbital velocity vs. mass. The two dotted upward-sloping lines are the velocities associated with 1 year
(bottom) and 1 day (top) orbital periods; a 1 year survey with 1 day cadence will be roughly sensitive to this range of time
periods. The downward-sloping blue line shows the minimum velocity β
c
, above which the jet is bright enough to be seen at
z = 0.6, assuming
![]() = 0.002 and
F
min = 1 mJy; this curve depends strongly on source distance, efficiency, and survey flux limit. Finally, the thick green line
is β
*, the velocity at which the binary separates from the circumbinary disk (Equation (9)). The shaded region is bounded by β
± and corresponds to the range of velocities where a binary is both isolated and detectable as a periodic source. The time
Δ
T a binary spends evolving through this region is Δ
T =
T(β
+) −
T(β
−) for
T given by Equation (8).
= 0.002 and
F
min = 1 mJy; this curve depends strongly on source distance, efficiency, and survey flux limit. Finally, the thick green line
is β
*, the velocity at which the binary separates from the circumbinary disk (Equation (9)). The shaded region is bounded by β
± and corresponds to the range of velocities where a binary is both isolated and detectable as a periodic source. The time
Δ
T a binary spends evolving through this region is Δ
T =
T(β
+) −
T(β
−) for
T given by Equation (8).
Other Images in This Article
Copyright and Terms & Conditions
© 2011. The American Astronomical Society. All rights reserved.