Image Details
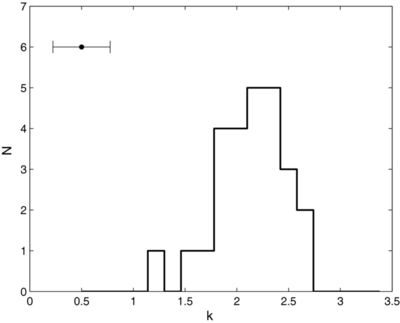
Caption: Figure 3.
Distribution of the derived density power-law index k for the sub-sample that is consistent with the coasting-in-wind model in both its phase 1 and phase 2—the consistent sub-sample. The top left horizontal bar shows the size of the typical error of k.
Other Images in This Article

Copyright and Terms & Conditions
© 2012. The American Astronomical Society. All rights reserved.
Copyright ©
2025 Astronomy Image Explorer. All Rights Reserved.