Image Details
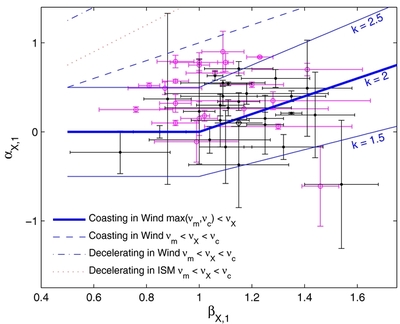
Caption: Figure 1.
X-ray decay index vs. spectral index during the plateau phase. The lines are the closure relations predicted by various models. The prediction from the coasting-in-wind model with max (ν m , ν c ) < ν (thick solid line) is the most capable of accounting for the data. The predictions from the same model with slight variations in k (thin solid lines) are also plotted. The data in open circles (magenta color) are those whose post-plateau decays are inconsistent with the decelerating phase (phase 2) of the coasting-in-wind model (see Figure 2 and in the text). GRB 061202, which shows a strong spectral evolution, is plotted as a diamond.
Other Images in This Article

Copyright and Terms & Conditions
© 2012. The American Astronomical Society. All rights reserved.