Image Details
Caption: Figure 2.
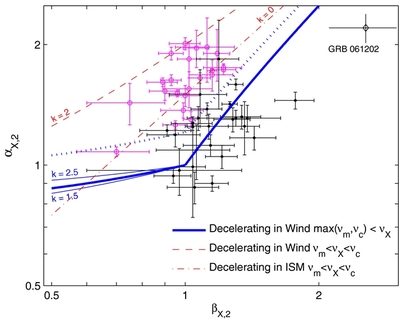
X-ray temporal index vs. spectral index during the post-plateau phase. The solid lines are for the decelerating phase of the
coasting-in-wind model. Note that for a decelerating blast wave with max (ν
m
, ν
c
) < ν and 2 <
p, α is independent of
k. The data in open circles (magenta color) are for the inconsistent sub-sample. The thick dotted line (blue color) is the
prediction for phase 2 of the coasting-in-wind model considering the radiative loss of blast wave energy (requiring ν
c
< ν
m
when
p > 2, and assuming
![]() e
= 0.3); it should be taken as an upper limit of α
X, 2
for a given β
X, 2
within this model because of the high
e
= 0.3); it should be taken as an upper limit of α
X, 2
for a given β
X, 2
within this model because of the high
![]() e
value assumed. The exceptional burst that shows a spectral evolution is labeled.
e
value assumed. The exceptional burst that shows a spectral evolution is labeled.
Other Images in This Article

Copyright and Terms & Conditions
© 2012. The American Astronomical Society. All rights reserved.