Image Details
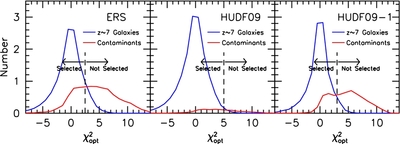
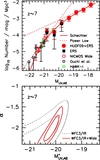
Caption: Figure 19.
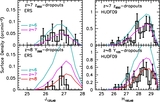
Apparent detection significance χ 2 opt (Appendix D: blue lines) expected for z ~ 7 galaxy candidates from simulations for three different data sets considered here: ERS (left), HUDF09 (center), and HUDF09-1 (right). Since z ~ 7 galaxies should not be detected in the optical, these distributions (blue lines) are, as expected, approximately centered on 0, with ~50% above and ~50% below 0 (due to noise). Also presented here (red lines) are the distributions expected for lower redshift contaminants in our fields (after excluding the obvious contaminants detected at >2σ in ⩾1 bands). The latter distributions (red lines: for the low-redshift contaminants) are estimated through the photometric scatter simulations described in Section 3.5.5. A dramatic demonstration of the added value from our full χ 2 opt approach can be seen in these figures. Note the large number of low-redshift galaxies we expect to satisfy our z ~ 7 LBG criterion that are not excluded by a 2σ optical non-detection criterion. This is effectively illustrated by the area under the red line. For fields with optical data of limited depths (e.g., the ERS or HUDF09-1 fields), this number can be comparable to the number of bona fide z ~ 7 galaxies. To effectively exclude these low-redshift contaminants, we derive χ 2 opt values for sources in our selections and then only select sources with small values of χ 2 opt, i.e., χ 2 opt < χ lim 2. For the HUDF09 and HUDF09-1 fields, the limiting values of χ 2 opt shown in this diagram are for sources selected ~0.7 mag brighter than the selection limit (~28.5 AB mag but this depends on the field). The dashed vertical lines show these χ 2 opt limits. The sources which exceed the χ 2 opt limits (but otherwise meet our selection criteria) are given in Tables 18, 19, and 20.
Other Images in This Article
Show More
Copyright and Terms & Conditions
© 2011. The American Astronomical Society. All rights reserved.