Image Details
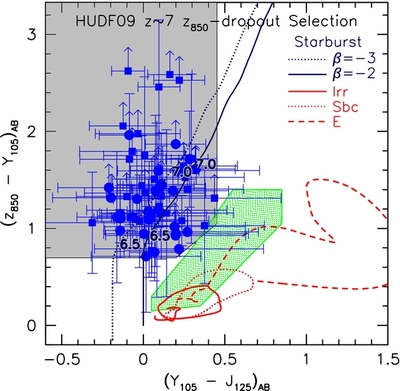
Caption: Figure 2.
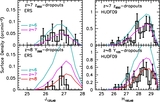
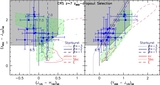
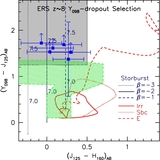
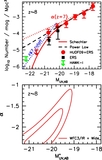
z 850 − Y 105 vs. Y 105 − J 125 two-color diagram we use to identify z ~ 7 z 850 dropouts over the three ultra-deep WFC3/IR HUDF09 fields (14 arcmin 2). The z − Y/ Y − J colors required for our z 850-dropout selection are indicated by the gray region. z 850-dropout candidates identified in the HUDF09, HUDF09-1, and HUDF09-2 fields are shown with the blue solid circles, blue open squares, and blue solid squares, respectively. The error bars and lower limits are 1σ. The blue lines show the expected colors of star-forming galaxies with UV-continuum slopes β of −3 and −2, while the red lines show the expected colors of low-redshift contaminants. The colors of low-mass L,T dwarf stars (e.g., Knapp et al. 2004) are indicated by the green squares. In addition to the two-color Lyman-break selection presented, we also enforce a very strict optical non-detection criterion involving a χ 2 opt quantity (Section 3.3; Appendix D). Through extensive simulations, we have found that a two-color LBG selection combined with strong constraints on the optical flux allow for the robust selection of star-forming galaxies at z ~ 7.
Other Images in This Article
Show More
Copyright and Terms & Conditions
© 2011. The American Astronomical Society. All rights reserved.