Image Details
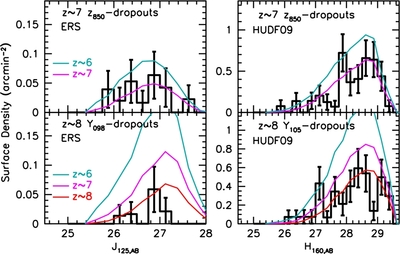
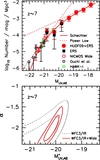
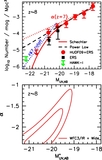
Caption: Figure 5.
Surface densities found in our z ~ 7 z 850-dropout (upper left) and z ~ 8 Y 098-dropout (lower left) selections over the wide-area ERS observations (black histograms, with 1σ errors) and in our z ~ 7 z 850-dropout (upper right) and z ~ 8 Y 105-dropout (lower right) selections over our HUDF09 observations (histograms). For comparison, we show the predicted surface densities based upon the Bouwens et al. (2007, 2008) determinations of the UV LF at z ~ 6 (cyan lines) and z ~ 7 (magenta lines). The solid red lines are the surface densities predicted extrapolating the Bouwens et al. (2008) LF results to z ~ 8 (based upon the fitting formula in that paper). The two H 160, AB ~ 26 Y 105 dropouts seen in the lower right panel—while exceeding the predicted surface densities for z ~ 8 star-forming galaxies—may be part of an overdensity (see Section 5.3).
Other Images in This Article
Show More
Copyright and Terms & Conditions
© 2011. The American Astronomical Society. All rights reserved.