Image Details
Caption: Figure 16.
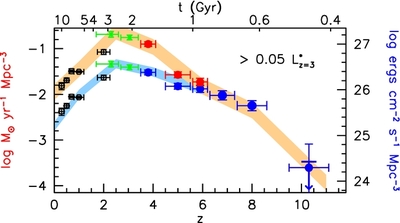
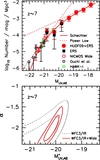
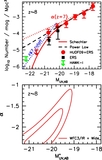
Luminosity density and SFR density determinations, as a function of redshift (Section 7.3). These determinations are integrated
to −17.7 AB mag (0.05
L*
z = 3
). The lower set of points (blue for our measurements) and shaded blue region are the observed luminosity densities and SFR
density estimates before dust correction. The upper set of points (red for our measurements) and shaded orange region indicates
the SFR density estimates after dust correction. The SFR density estimates assume
![]() 100 Myr constant SFR and a Salpeter IMF. Conversion to a Kroupa (2001) IMF would result in a factor of ~1.7 (0.23 dex) decrease
in the SFR density estimates given here. At
z ≲ 2 dust corrections are from Schiminovich et al. (2005), at
z ~ 3–6 from Bouwens et al. (2009b), and at
z
100 Myr constant SFR and a Salpeter IMF. Conversion to a Kroupa (2001) IMF would result in a factor of ~1.7 (0.23 dex) decrease
in the SFR density estimates given here. At
z ≲ 2 dust corrections are from Schiminovich et al. (2005), at
z ~ 3–6 from Bouwens et al. (2009b), and at
z
![]() 7 they are assumed to be zero. The solid circles at
z ~ 7 and
z ~ 8 are the present determinations. For context, we have also included the SFR density estimates at
z ~ 4–6 from Bouwens et al. (2007), at
z ~ 2–3 from Reddy & Steidel (2009, green crosses), and at
z ≲ 2 from Schiminovich et al. (2005, black squares). The estimates at
z ~ 10 (Bouwens et al. 2011) are given with the blue circles and upper limit. See Table 8 for a tabulation of the
z
7 they are assumed to be zero. The solid circles at
z ~ 7 and
z ~ 8 are the present determinations. For context, we have also included the SFR density estimates at
z ~ 4–6 from Bouwens et al. (2007), at
z ~ 2–3 from Reddy & Steidel (2009, green crosses), and at
z ≲ 2 from Schiminovich et al. (2005, black squares). The estimates at
z ~ 10 (Bouwens et al. 2011) are given with the blue circles and upper limit. See Table 8 for a tabulation of the
z
![]() 4 luminosity densities and SFR densities presented here.
4 luminosity densities and SFR densities presented here.
Other Images in This Article
Show More
Copyright and Terms & Conditions
© 2011. The American Astronomical Society. All rights reserved.