Image Details
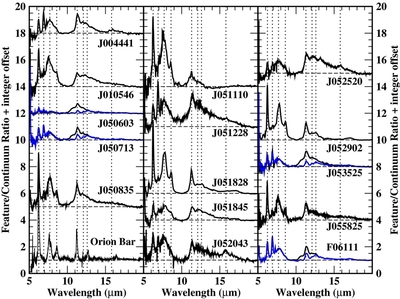
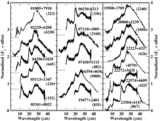
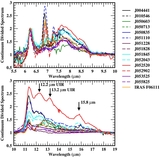
Caption: Figure 8.
UIR feature-to-continuum ratios are plotted for the 15 objects where good model fits are available. The dotted lines mark the wavelengths of common UIR features. Where the IRS spectrum is suspected to have an SiC emission feature, the ratio curve is shown for both the amorphous carbon only continuum model (black curves) and for the best-fit model continuum with the SiC feature (blue curves). The dashed lines show the continuum levels for the different ratio spectra. For comparison a normalized UIR spectrum of the Orion Bar from the ISO SWS instrument is shown on the lower left.
Other Images in This Article
Show More
Copyright and Terms & Conditions
© 2011. The American Astronomical Society. All rights reserved.
Copyright ©
2026 Astronomy Image Explorer. All Rights Reserved.