Image Details
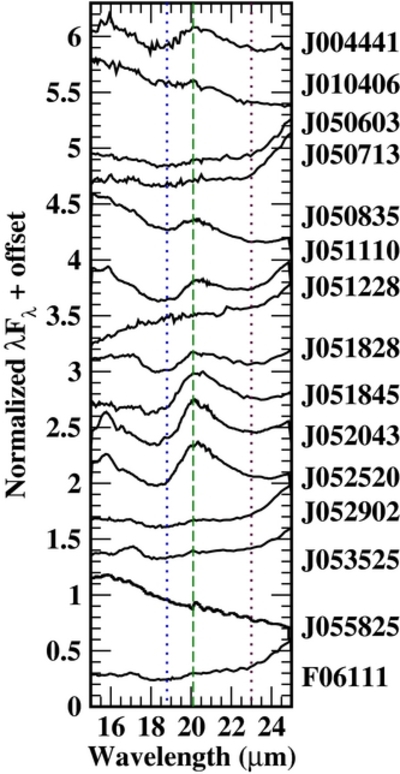
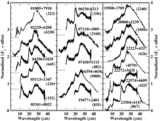
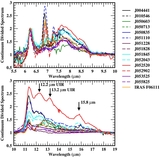
Caption: Figure 2.
IRS spectra for the 15 objects with typical carbon-rich PPNe spectra are replotted here from 15 to 25 μm, normalized to 1 at 20 μm and offset to separate the different objects. The dashed line marks the 21 μm feature peak wavelength. The two dotted lines show the approximate starting and ending wavelengths of the feature. As can be seen in this figure, there is some variation in the positions of the spectral minima at shorter and longer wavelengths around the feature, likely due to variations in the continuum shape and in the strength of the adjacent features.
Other Images in This Article
Show More
Copyright and Terms & Conditions
© 2011. The American Astronomical Society. All rights reserved.
Copyright ©
2026 Astronomy Image Explorer. All Rights Reserved.