Image Details
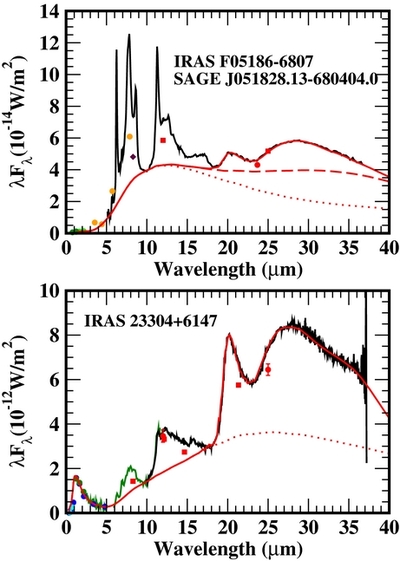
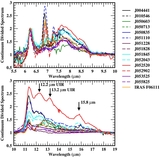
Caption: Figure 6.
Top panel: the observations of object J051828 are shown as in Figure 1 with the model fit overplotted. The solid curve shows the overall model fit, the dashed curve shows the amorphous carbon continuum fit with the discrete shells to boost the continuum under the features, and the dotted curve shows the corresponding continuum fit with a smooth density distribution. Bottom panel: the Spitzer IRS and ISO PHT-S (below 10 μm) spectra of IRAS 23304+6147 along with the available photometry are shown with the model fit overplotted. As in the top panel, both the full model fit and the model amorphous carbon continuum from a smooth density profile are plotted to illustrate the difference between the Galactic and Magellanic Cloud models.
Other Images in This Article
Show More
Copyright and Terms & Conditions
© 2011. The American Astronomical Society. All rights reserved.