Image Details
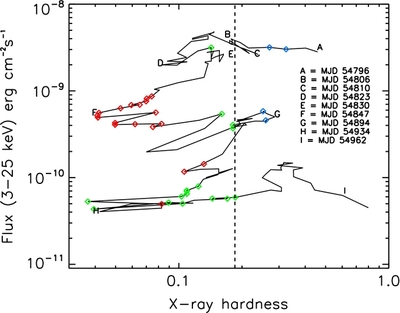
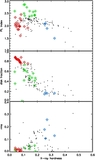
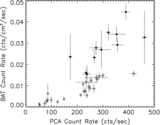
Caption: Figure 6.
Hardness–intensity diagram for Swift J1539.2−6227 showing the flux in the 3–25 keV band vs. the X-ray color (9.14–25.11 keV/2.87–9.14 keV). The letters represent major changes in direction of the trace. The dashed line indicates the transitions between the hard-intermediate (to the right) and soft-intermediate states (to the left). Red points indicate the thermal state, green SPL, and blue the hard state as derived using the definitions of RM06 (see Section 5.1). Note that these definitions do not always correspond to more traditional definitions of spectral states.
Other Images in This Article
Copyright and Terms & Conditions
© 2011. The American Astronomical Society. All rights reserved.
Copyright ©
2025 Astronomy Image Explorer. All Rights Reserved.