Image Details
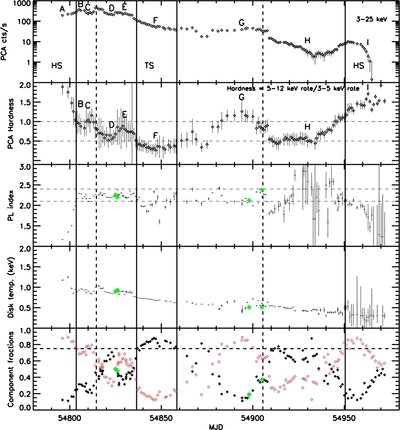
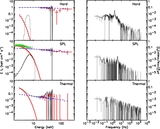
Caption: Figure 2.
Hardness ratio and fit parameters. The top panel repeats the PCA light curve from Figure 1. The second panel shows the PCA hardness ratio. The energy ranges are 4.81–11.94 keV/2.87–4.81 keV (approximated in the plot labels). The letters correspond to the turning points in the hardness–intensity plot in Figure 6. The third panel shows the power-law index. The fourth panel shows the disk temperature for a black body model. The bottom panel shows the fraction of the flux in each of the primary models. Red (crosses in black and white version): power law, black dots: disk. The vertical lines are defined in the caption to Figure 1. The horizontal lines are defined as follows. In the second and third panels, lines show the boundaries of the hard (above top line) and soft (below bottom line) states, as in McClintock & Remillard (2006, for second panel) and RM06. The line in the bottom panel indicates 75% component fraction. On the three bottom plots the parameter values from the joint XRT/PCA/HEXTE fits are shown as green (open in black and white) diamonds, indicating consistency of the fits.
Other Images in This Article
Copyright and Terms & Conditions
© 2011. The American Astronomical Society. All rights reserved.