Image Details
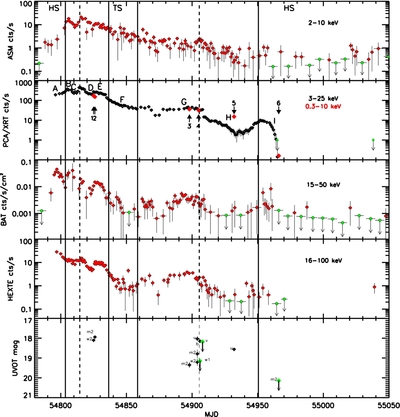
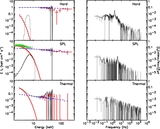
Caption: Figure 1.
Light curves for Swift J1539.2−6227 for the six instruments, RXTE/ASM, RXTE/PCA, Swift/XRT, Swift/BAT, RXTE/HEXTE, and Swift/UVOT. On the PCA plot (from which the residual background has been subtracted), the times of the Swift/XRT observations are indicated by arrows. The solid vertical lines in this and subsequent plots represent the end of the early and start of the late hard states, and the duration of the thermal state as discussed in the text (Section 5.1). The dashed vertical lines indicate the transitions from the hard to soft-intermediate states. On the BAT, ASM, and HEXTE light curves red (diamond) points are detections (error bars do not include zero) and green (crosses in black and white version) are upper limits. In the second panel, red points (crosses in black and white version) are XRT counts s −1. The letters in the PCA panel correspond to the turning points in the hardness–intensity plot in Figure 6. The actual energy range for the PCA data (approximated in the plot labels) is 2.87 to 25.11 keV.
Other Images in This Article
Copyright and Terms & Conditions
© 2011. The American Astronomical Society. All rights reserved.