Image Details
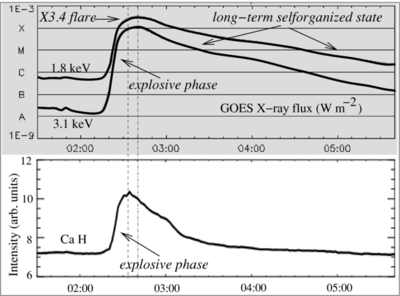
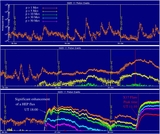
Caption: Figure 9.
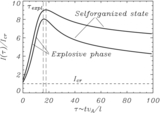
GOES X-ray and SOT Ca H intensity curves. (a) The explosive phase and long-term, self-organized state of coronal plasma; (b) Ca H intensity curve shows that the peak of energy release in the chromosphere (dashed line) precedes the peak in the corona (dot-dashed line) by 6 minutes. Post-flare regime is significantly shorter in the chromosphere than in the corona.
Other Images in This Article
Copyright and Terms & Conditions
© 2011. The American Astronomical Society. All rights reserved.
Copyright ©
2025 Astronomy Image Explorer. All Rights Reserved.