Image Details
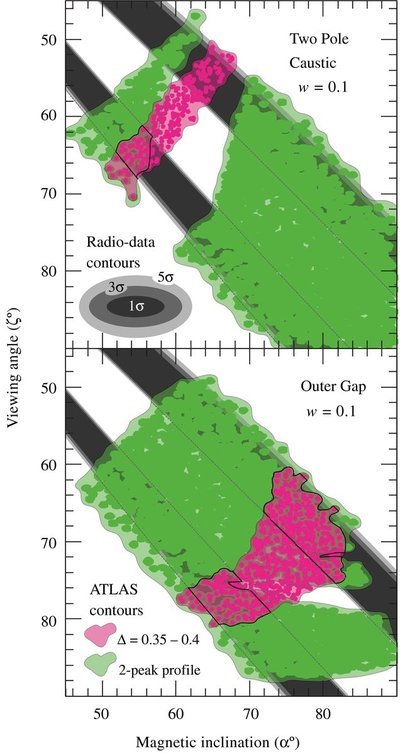
Caption: Figure 4.
Plots of the magnetic inclination, α, vs. the viewing angle, ζ, for γ-ray pulsars with two-pole caustic emission regions (top) and outer gap regions (bottom), and with an assumed gap thickness of the emission region of w ~ 0.1. In these plots, the allowed geometries from the ATLAS maps of Watters et al. (2009) are shown with green and pink contours: the green contours correspond to a γ-ray profile with two major peaks; the pink contours, to a profile with phase separation of 0.35–0.4 pulse periods between the major peaks. In both models, the geometry is further constrained by the gray-scale contours that were derived from RVM fits to the radio-polarization data of PSR J2043 + 2740. The overlapping regions between the ATLAS and radio contours are delineated with solid, black lines.
Other Images in This Article
Copyright and Terms & Conditions
© 2011. The American Astronomical Society. All rights reserved.