Image Details
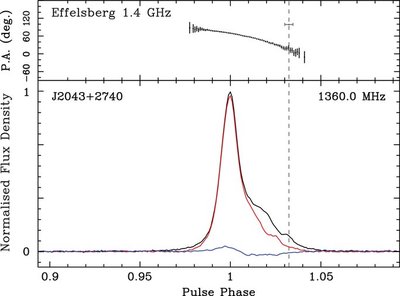
Caption: Figure 1.
Polarization profile of PSR J2043 + 2740, at 1.4 GHz, from a 45 minute integration with the Effelsberg radio telescope. Bottom panel: profiles of the total intensity (black, solid line), linearly polarized intensity (red line), and circularly polarized intensity (blue line). Top panel: P.A. profile (black error bars). The gray dashed line denotes the rotational phase at the minimum approach of the line of sight to the magnetic pole (i.e., ϕ 0). The uncertainty on ϕ 0 is shown with a horizontal error bar.
Other Images in This Article
Copyright and Terms & Conditions
© 2011. The American Astronomical Society. All rights reserved.
Copyright ©
2025 Astronomy Image Explorer. All Rights Reserved.