Image Details
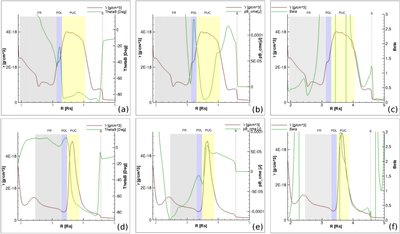
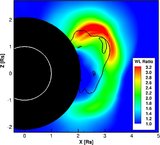
Caption: Figure 2.
One-dimensional plots showing locations of the flux rope (FR) with light gray, PDL with light blue, PUC with light yellow shaded regions, respectively, while shock (S) is shown with light red dash-shaded regions when shock is at ~4.6 R ☉ along the white line shown in Figure 1 for GL at 30 minutes and TD at 48 minutes. Top row from left: plots for (a) density and θ B , (b) density and magnetic pressure ( pB cme), and (c) density and plasma beta (β) for GL. Bottom row from left: plots for (d) density and θ B , (e) density and pB cme, and (f) density and β for TD. The shocks are at about the same distances from the Sun along the line shown in Figure 1.
Other Images in This Article
Copyright and Terms & Conditions
© 2011. The American Astronomical Society. All rights reserved.