Image Details
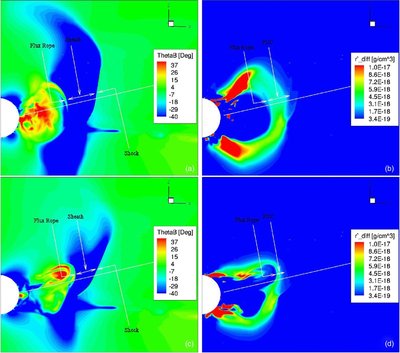
Caption: Figure 1.
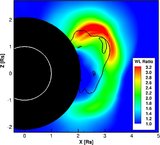
Two-dimensional contour plots at
Y = 0.4
R
☉ plane showing flux rope, shock, and sheath. Top row from left: (a) contours with θ
B
and (b) with
r
diff for GL at 30 minutes where,
 ,
B = total magnetic field,
B
N
= magnetic field along
,
B = total magnetic field,
B
N
= magnetic field along
 .
.
 gives the radial direction away from the Sun,
 points toward solar rotation axis,
 and
and
 . We can see that θ
B
is a very useful tool to locate the flux rope (Evans et al. 2011);
r
diff = (solar wind density at 30 minutes) − (background solar wind density), showing only the "positive" part of the contour.
Background solar wind density is the density of the solar wind before the CME was inserted. Bottom row from left: (c) contour
with θ
B
and (d) with
r
diff for TD at 48 minutes. Following the white line shown in the plots, we collect and analyze the data in the plots to be followed.
. We can see that θ
B
is a very useful tool to locate the flux rope (Evans et al. 2011);
r
diff = (solar wind density at 30 minutes) − (background solar wind density), showing only the "positive" part of the contour.
Background solar wind density is the density of the solar wind before the CME was inserted. Bottom row from left: (c) contour
with θ
B
and (d) with
r
diff for TD at 48 minutes. Following the white line shown in the plots, we collect and analyze the data in the plots to be followed.
Other Images in This Article
Copyright and Terms & Conditions
© 2011. The American Astronomical Society. All rights reserved.