Image Details
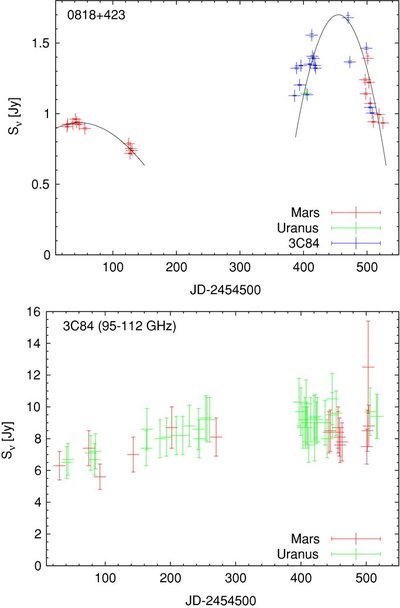
Caption: Figure 5.
Millimeter variability of the phase calibrator J0818+423. Top: measured ~105 GHz flux for the tracks in this project where a primary calibrator was observed, bootstrapped relative to the flux calibrators indicated in the bottom right corner. Error bars indicate the variance of individual measurements within a track. The black line indicates a fit to the data. Bottom: measured 95–112 GHz fluxes of 3C84 over the same time range (CARMA archive; S. Schnee 2009, private communication), bootstrapped relative to the flux calibrators indicated in the bottom right corner. Error bars include the absolute calibration uncertainty. This comparison shows that the variability among tracks bootstrapped relative to 3C84 is not due to intrinsic short-term variability of 3C84 itself.
Other Images in This Article

Copyright and Terms & Conditions
© 2010. The American Astronomical Society. All rights reserved.