Image Details
Caption: Figure 2.
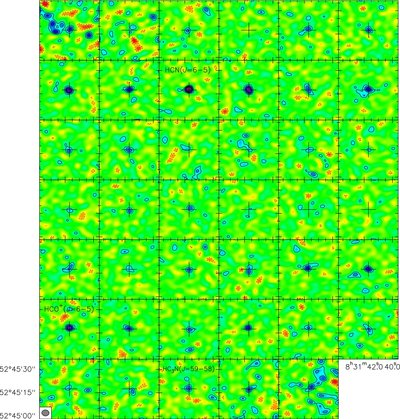
Channel maps of the data shown as a spectrum in Figure
1 (left) at the same velocity resolution. Frequencies increase with channel number from left to right, i.e., red to blue. The
peak channels of the redshifted HCN, HCO
+, and HC
3N lines are indicated. Contours are shown at (−3, −2, 2, 3, 4, 5, 6, 7, 8) σ (1σ = 0.95 mJy beam
−1). The beam size (4
![]() 5×3
5×3
![]() 6) is shown in the bottom left corner. The cross indicates a position of 08
h31
m41
6) is shown in the bottom left corner. The cross indicates a position of 08
h31
m41
![]() 70, +52°45′17
70, +52°45′17
![]() 5 between the CO lens images (Riechers et al. 2009).
5 between the CO lens images (Riechers et al. 2009).
Other Images in This Article

Copyright and Terms & Conditions
© 2010. The American Astronomical Society. All rights reserved.
Copyright ©
2025 Astronomy Image Explorer. All Rights Reserved.