Image Details

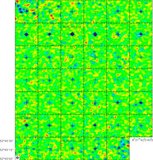
Caption: Figure 3.
Channel maps of the central 12 channels of the data shown as a spectrum in Figure
1 (middle) at the same velocity resolution. Frequencies increase with channel number from left to right, i.e., red to blue.
The peak channel of the redshifted HNC line is indicated. Contours are shown at (−3, −2, 2, 3, 4, 5, 6) σ (1σ = 0.88 mJy beam
−1). The beam size (5
![]() 3×4
3×4
![]() 6) is shown in the bottom left corner. The cross indicates the same position as in Figure
2.
6) is shown in the bottom left corner. The cross indicates the same position as in Figure
2.
Other Images in This Article
Copyright and Terms & Conditions
© 2010. The American Astronomical Society. All rights reserved.
Copyright ©
2025 Astronomy Image Explorer. All Rights Reserved.