Image Details
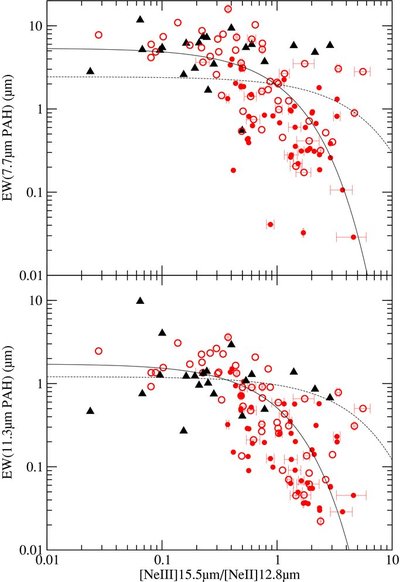
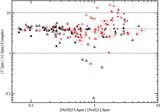
Caption: Figure 9.
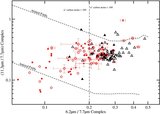
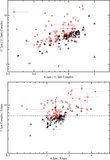
Diagnostic diagram between an indicator of the hardness of the radiation field and [Ne iii]15.5/[Ne ii]12.8 μm versus EW 7.7 μm (top) and EW 11.3 μm (bottom) PAH emission features. Full triangles are SBs taken from Brandl et al. (2006), and full and empty circles are Sy 1 and Sy 2 of our and Gallimore et al. (2010) sample. Error bars are shown only for the 15 new AGNs; similar errors were found for the remaining objects. The lines represent an exponential regression fitted for the total sample (dotted line) and for the AGN sub-sample (solid line).
Other Images in This Article
Copyright and Terms & Conditions
© 2010. The American Astronomical Society. All rights reserved.
Copyright ©
2025 Astronomy Image Explorer. All Rights Reserved.