Image Details

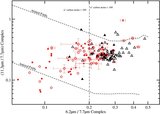
Caption: Figure 6.
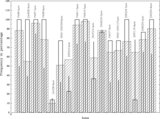
Diagnostic diagram of the relative strengths of the neutral (8.6 μm and 11.3 μm) compared to the ionized (6.2 μm and 7.7 μm) PAH bands. In the top, 6.2 μm/11.3 μm × 7.7 μm/11.3 μm PAHs are shown. Empty triangles are H ii and LINER objects taken from Smith et al. (2007) and Gordon et al. (2008), full triangles are SBs taken from Brandl et al. (2006), and full and empty circles are Sy 1 and Sy 2 of our and Gallimore et al. (2010) sample. Error bars are shown only for the 15 new AGNs; similar errors were found for the remaining objects. The dotted line separates high- and low-ionization objects.
Other Images in This Article
Copyright and Terms & Conditions
© 2010. The American Astronomical Society. All rights reserved.
Copyright ©
2025 Astronomy Image Explorer. All Rights Reserved.