Image Details
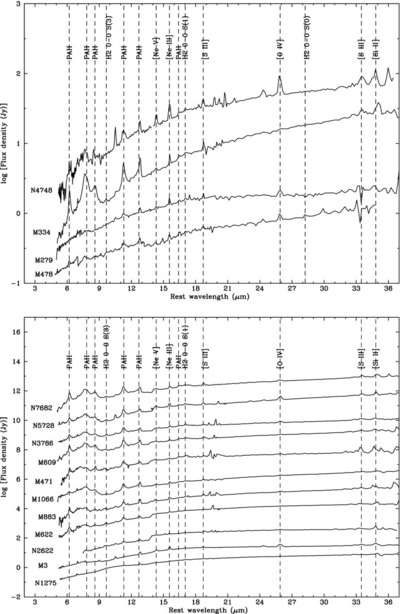
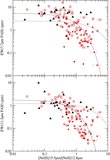
Caption: Figure 2.
Calibrated spectra of the Sy 1 (top) and Sy 2 (bottom) galaxies. All spectra were ordered according to their shapes from a steeper spectrum (top) to a flatter one (bottom). Some emission lines are identified. All spectra were normalized at 23 μm.
Other Images in This Article
Copyright and Terms & Conditions
© 2010. The American Astronomical Society. All rights reserved.
Copyright ©
2025 Astronomy Image Explorer. All Rights Reserved.