Image Details
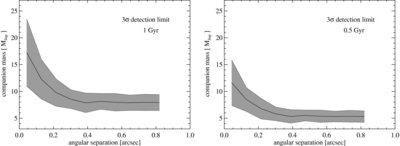
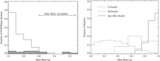
Caption: Figure 5.
Comparison of achieved detection limits for companion masses at ages of 1 Gyr (left image) and 0.5 Gyr (right image). The derived contrast limits of each observing run were converted into masses based on the evolutionary models from Baraffe et al. (2003) as described in the text. The images display the mean detectable mass limit with the shaded areas representing the standard deviation.
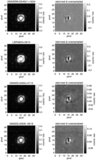
Other Images in This Article


Copyright and Terms & Conditions
© 2010. The American Astronomical Society. All rights reserved.
Copyright ©
2025 Astronomy Image Explorer. All Rights Reserved.