Image Details

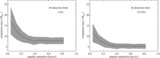
Caption: Figure 4.
Image illustrates the achievable sensitivity in magnitude difference Δ F108N for our SDI survey as a function of angular separation. The bold solid line corresponds to the mean 3σ detection limit of all observing runs (excluding the two confirmed and clearly resolved binary systems). The upper and lower shaded curves correspond to the standard deviation.
Other Images in This Article


Copyright and Terms & Conditions
© 2010. The American Astronomical Society. All rights reserved.
Copyright ©
2025 Astronomy Image Explorer. All Rights Reserved.