Image Details

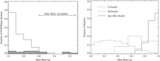
Caption: Figure 1.
Observed spectra of L and T dwarfs (from S. Leggett's online archive, http://staff.gemini.edu/~sleggett/LTdata.html) with the superimposed bandpass of the HST F108N and F113N filters. The T dwarf plot additionally includes the synthetic spectrum of a 5 M Jup, 1 Gyr old PMO with T eff = 312 K (Burrows et al. 2003). For a better comparison all flux is arbitrarily scaled.
Other Images in This Article


Copyright and Terms & Conditions
© 2010. The American Astronomical Society. All rights reserved.
Copyright ©
2025 Astronomy Image Explorer. All Rights Reserved.