Image Details
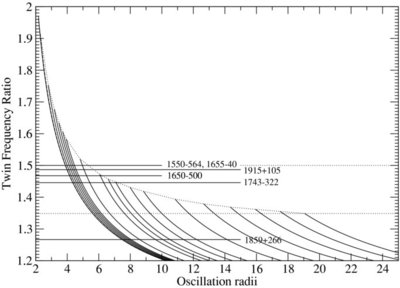
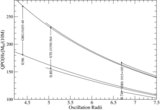
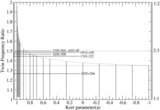
Caption: Figure 8.
Microquasars exhibit that twin-peak QPOs are shown with their respective frequency correlation ratios. Each solid curve is plotted in terms of their frequency ratios and oscillations radii for a = 0.999, 0.998(dotted), 0.99, 0.98, 0.97, 0.96, 0.95, 0.90, 0.80, 0.75, 0.70, 0.60, 0.50, 0.25, 0.0, −0.50, − 0.75, − 0.999 (from left curve to right). Highest possible resonance oscillation is 2:1 which can occur a ~ 1. Envelop of each curve shows extreme correlation ratio which indicates that even an extreme retrograde black hole can exhibit frequency ratio of 1.35 (dotted horizontal line).
Other Images in This Article
Copyright and Terms & Conditions
© 2010. The American Astronomical Society. All rights reserved.
Copyright ©
2025 Astronomy Image Explorer. All Rights Reserved.