Image Details
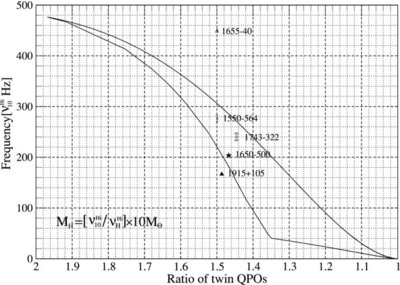
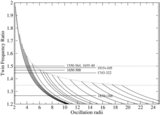
Caption: Figure 10.
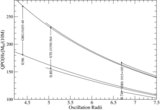
High-frequency (ν Hi 10) QPO of a 10 M ☉ black hole plotted against their peak ratios. The upper curve is drawn for a = 0.999, while the lower curve is drawn for extreme peak ratios with a short extension curve (straight line) for a = −0.999. The upper curve helps us to estimate maximum possible mass values, while the lower curve gives minimum possible mass of the microquasars from Equation (26).
Other Images in This Article
Copyright and Terms & Conditions
© 2010. The American Astronomical Society. All rights reserved.
Copyright ©
2025 Astronomy Image Explorer. All Rights Reserved.