Image Details
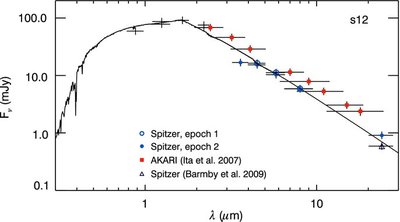
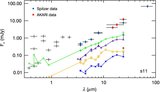
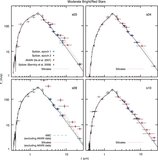
Caption: Figure 6.
SED of source s12. The solid black line shows the best fit marcs model (see Section 3.3). The underluminous 3.6 μm flux appears to be the cause of the [3.6] − [8] excess apparent in Figure 4 and may be due to poor photometry or possibly due to absorption from acetylene. AKARI fluxes are systematically too bright, which may be due to stellar blending.
Other Images in This Article
Copyright and Terms & Conditions
© 2009. The American Astronomical Society. All rights reserved.
Copyright ©
2025 Astronomy Image Explorer. All Rights Reserved.