Image Details
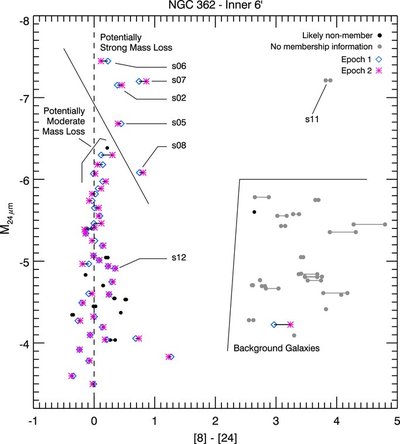
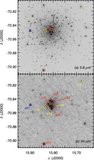
Caption: Figure 3.
[24] vs. [8] − [24] color–magnitude diagram. Lines connect points from each IRAC epoch. Five sources are identified as candidates of strong dusty mass-loss, and five others are candidates for moderate dusty mass loss. One of the moderately dusty candidates is a likely cluster nonmember (source s01).
Other Images in This Article
Copyright and Terms & Conditions
© 2009. The American Astronomical Society. All rights reserved.
Copyright ©
2025 Astronomy Image Explorer. All Rights Reserved.